In the course of this work, sample images have been acquired using a modified Canon 9030 laser copier, a flat-bed, CCD-based device with a maximum image size of A3 (420 x 297 mm), automatic thresholding and operator-selectable resolution (up to 400 d.p.i.). More recently, a Hewlett Packard Scanjet (also a flat-bed, CCD-based scanner) has been used, although this was limited to 300 d.p.i., A4 (297 x 210 mm) sized images. Thresholding was again done automatically, although a contrast control was available via the Scanjet driver software (which was normally set to darken'). The first images, scanned at full 400 d.p.i. resolution, included a variety of score formats (layouts and font sizes) from a solo instrument part through solo instrument with piano accompaniment to full orchestral score. Monophonic and polyphonic forms of music were thus included. The images also included examples of poor-quality print and symbols such as very long, almost horizontal slurs and similarly-dimensioned multiple beams, chosen to thoroughly test the recognition routines. The resulting 400 d.p.i. binary images each consisted of 4680 rows of 3344 pixels, requiring nearly 2 Mbytes of storage per A4 page using bit-per-pixel representation. The highest possible resolution was used initially despite the greater processing time involved in manipulating larger amounts of information. This was to some extent allevIated
-89-
by the fact that only small portions of a complete page were used while developing routines - a situation suited to the limited size of display devices available (maximum 1024 by 768 pixels). Experience showed that in general 300 d.p.i. (the resolution used most extensively) was perfectly adequate, but that 400 d.p.i. or higher was desirable when dealing with small notation (cues, for example) or exceptionally poor quality print, or indeed a combination of the two. It had to be borne in mind that a reduction in resolution from 400 to 300 d.p.i. (or even 300 to 200 d.p.i.) almost halved the amount of data involved. A reduction of resolution to 200 d.p.i. did however result in significant loss of detail and was not used in this work.
The first operation used (optionally) on an image was one of pre-processing using a horizontally-orientated low-pass filter. This filled gaps of up to phi pixels between set (black) pixels within individual horizontal lines and had the effect of removing short breaks in both stavelines and symbols. The maximum value of phi used was four. This filter will be mentioned again later when discussing structural segmentation techniques and line-following algorithms.
4.2 EXPERIMENTAL SEGMENTATION
As mentioned in section 3.3.4, the first step in segmenting any image of printed music involves locating the stavelines which are a mandatory component of all scores using conventional music notation. As a preliminary experiment, a test image was chosen so that any stavelines present in the image were horizontal, although
-90-
for several reasons this is often not the case. It did, however, enable the simple technique of forming the histogram of the horizontal sums of black pixels to be used as the basis of an elementary stave-finding routine. Once the histogram had been obtained, groups of five peaks were easily detected, indicating the presence of staves. Allocation of pixels to stavelines could then be achieved by obtaining another histogram, in this case of the height of the vertical runs of black pixels which crossed a row indicated by the staveline-finding procedure. By tracking across the image in the appropriate rows and marking all vertical runs of black pixels whose height was below a threshold derived from the second histogram, the staveline pixels could be found.
This method had several major weaknesses, but its implementation provided some important indications of the problems involved in segmenting an image of printed music, some of which appeared to be unique to the subject. Firstly, it could not be assumed that stavelines were horizontal across the whole page - nor indeed that they continued across the whole page - which in itself invalidated use of the horizontal-sum histogram. Secondly, the setting of a fixed threshold for the thickness of a staveline (i.e. the vertical run of pixels which were to be marked as staveline pixels) would take no account of local thickness maxima. Consequently, a single run of pixels which exceeded a given thickness threshold would be treated as symbol rather than staveline, despite the possibility that in context this could be obviously incorrect. Thirdly, although the stavelines may have been horizontal on the original printed page, there was no guarantee that the page was exactly level when scanned.
-91-
Consequently, the image may have been slightly skew - and a rotation of less than 30' could cause the peaks of the horizontal-sum histogram to merge, rendering the technique useless. Other problems arose, such as determining the extent to which a symbol coincided with a staveline. For example, where a notehead was situated in a stave space, i.e. overlapping two stavelines, the shape of the isolated notehead would vary depending on the amount of overlap assumed by the staveline extraction process. This would, in turn, have a bearing on the recognition routines, which would need to be immune to such variations. Similarly, but more significantly with regard to recognition, where part of a symbol coincided completely with a staveline and was below the threshold value for maximum staveline thickness, this part would be categorised as staveline rather than symbol. The highest part of the main section of a bass clef is a common example of this situation, as is the portion of the treble clef which normally coincides with the lowest of the five stavelines.It was thus deemed necessary to develop a means of segmenting an image which would enable location of the stavelines regardless of a reasonable amount of rotation of the image (say +/- 10°) whilst also coping with slight bowing of stavelines and local thickness maxima. Ideally, 'regional information' would also be produced which could be used in determining whether a symbol had merged with a staveline.
-92-
4.3 SEGMENTATIONIt should be pointed out that an advantage of the method described in this section is that the image breakdown achieved serves not only in finding stavelines but also in providing structural analysis of symbols and in providing a convenient method of manipulating the components of the image.
The segmentation technique which was employed made use of an original transformation (developed in the course of this work) of the line adjacency graph (LAG) [Pavlidis 1982], which was obtained directly from a run length encoding of the binary image. Two passes were made over the data in order to achieve segmentation. The first produced the run length encoded version of the image, with the runs of pixels (segments) orientated vertically (figure 4.1). The second pass constructed the transformed LAG. Although the two stages could have been combined, they were kept separate because some scanners produce run length encoded data directly, thus obviating the need for stage one. Also, for reasons of efficiency, the transformed LAG was produced directly from the run-length encoding rather than creating the LAG and then subsequently performing the transformation. The LAG has been used successfully elsewhere as the basis of pattern recognition systems for Chinese characters, English text, and electrical circuit diagrams, as described in section 3.2.
By proceeding from left to right across the image and considering pairs of columns of run length encoded data, the segments were grouped together to form sections (nodes of the transformed LAG). If a segment existed in the right hand column
-93-
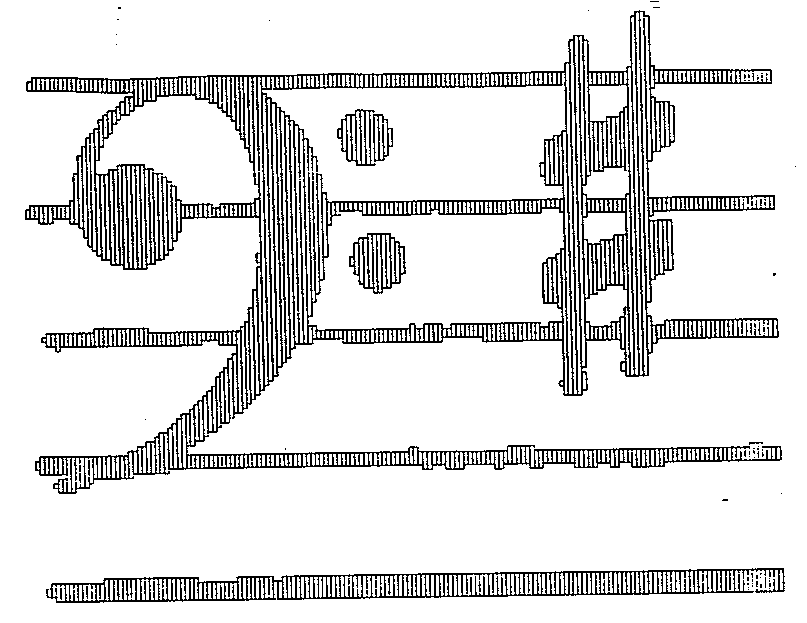
Figure 4.1 A fragment of an image showing the boundaries of the segments formed by vertical run-length encoding.
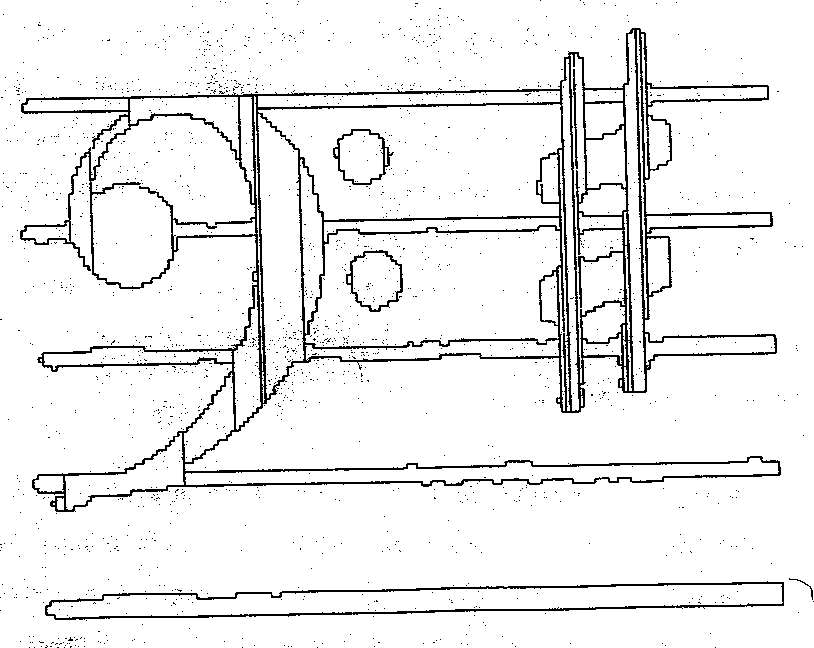
Figure 4.2 The image fragment of figure 4.1 showing the boundaries of the sections (the nodes of the transformed LAG).
-94-
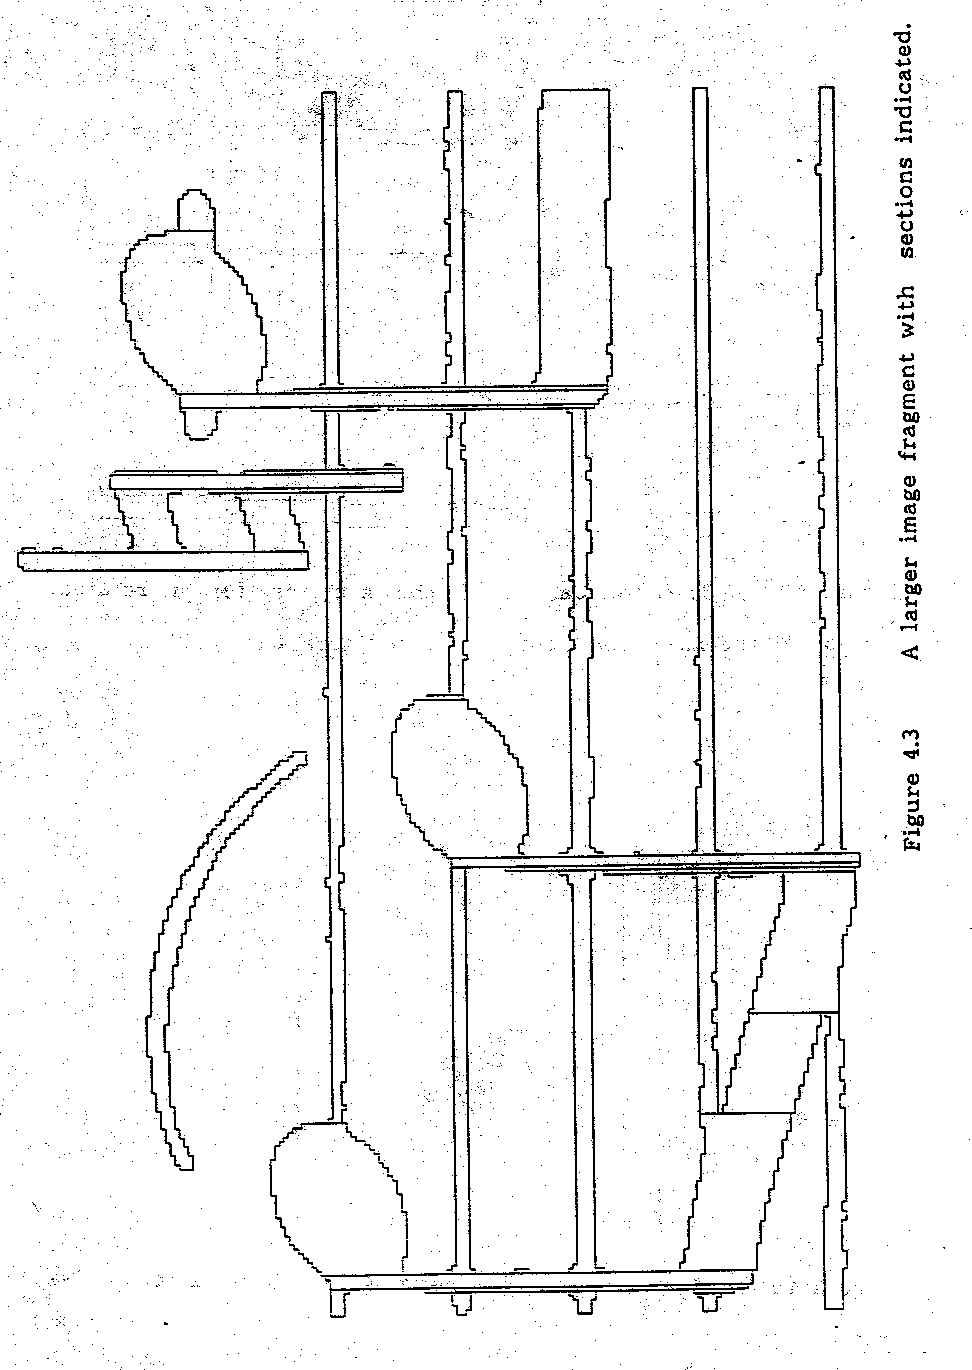
and did not overlap a segment in the left hand column, a new section was created and the segment allocated to that section. If the reverse was the case (i.e. the segment was in the left hand column and unconnected) then the section to which the segment belonged could be terminated. If a pair of segments were single-connected to each other then the right hand segment could be allocated to the section of the left hand segment. The other possibility was a multi-way junction, where a single segment in one column overlapped more than one segment in the other column. In this situation the appropriate section or sections were terminated (left hand column) or initialized (right hand column). When the transformed LAG of an image of printed music was produced, some of the nodes of the graph corresponded to structural components of the musical symbols. This correspondence was improved by the addition of one further rule. This required that the section which was currently being processed would be terminated if the ratio of its average thickness (segment height) to the height of the next segment to be added to that section exceeded 2.5 : 1. If this was the case, then the next segment was allocated to a new section. Otherwise, for example, the right-most part of the bass clef symbol would form a single section with the staveline on which it was superimposed (figure 4.2) as would black noteheads (figure 4.3).
Using this segmentation technique resulted in a fundamentally consistent sectioning of the image regardless of limited rotation of the original (figure 4.4). In addition, subsequent processing operated on the section data, giving a significant increase in speed over a technique operating on individual pixels (see section
-95-
-96-
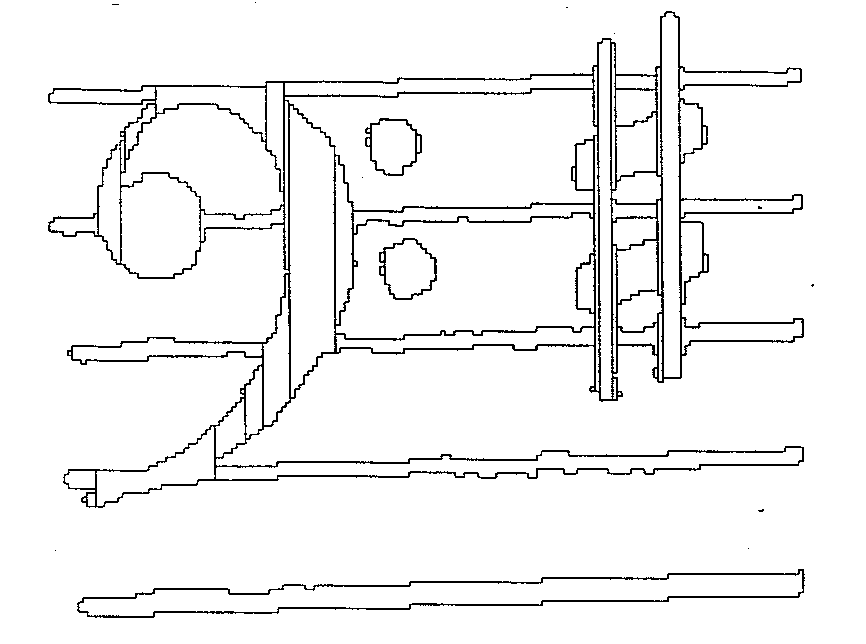
Figure 4.4 The boundaries of the sections for a rotated version of the image fragment shown in figure 4.1.
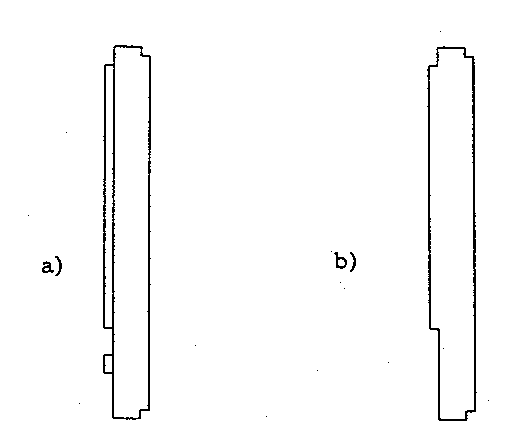
Figure 4.5 The process of merging sections after noise removal.
-97-
3.3.4 regarding Roach and Tatem's work). Various attributes of the section were stored together as an entry in a data structure. These included, for example, x-minimum, x-maximum, y-minimum, y-maximum, a pointer to a segment list (containing the y-ordinates of the start and end of each run of pixels), area (number of set pixels), pointers to lists of forward and backward connections to other sections, and various summations which were used in calculating a least squares fit straight line through the mid-points of the segments.
4.4 NOISE REMOVAL
All sections with a small area (lambda pixels or less, where lambda was commonly five for a 300 or 400 d.p.i. image) which had no connections or one connection - either forwards or backwards - were removed as noise. As a result of removing a single-connected noise section, the section to which it was connected may itself have become single-connected. In this case, the sections involved were merged if a multi-way junction in the original image had now disappeared, provided that the thickness ratio test originally applied when producing the transformed LAG was satisfied. For example, in figure 4.5a, there is a noise section attached to a vertical stroke. After removal of the noise section, the two remaining sections would be single-connected. These would then be merged into a single section as shown in figure 4.5b. To reiterate, merging did not take place if a multi-way junction still remained despite the removal of the noise section, or if the thickness ratio between the two sections was greater than 2.5 : 1.
-98-
4.5 FILAMENTS AND STAVELINE FINDING
In order to find potential staveline sections (filaments), a search was made of the section list to find those which fulfilled the following criteria :-
i) aspect ratio (i.e. length / average thickness) > alpha
ii) forward and backward connected
iii) curvature (variance figure produced by least squares fit) < beta
Figures for alpha and beta used were, respectively, 10 and one.
Test i) selected sections which were relatively long and thin without introducing any absolute measurements. Consequently, some sections which were long beams were included as potential staveline sections. These were filtered out at a later stage by forming a histogram of filament thickness over the complete page and deriving a cut-off point for permitted thickness. The threshold used was 'mean + 3 x standard deviation', as indicated in figure 4.6.
Test ii) was aimed at eliminating other relatively long and thin lines which were not fragments of staveline but which may have occurred in an image of printed music and which would not be filtered out by the above procedure. Examples included markings for crescendo and diminuendo ('hairpins'), text prolongation, part overlap indication (e.g. in vocal short score) and other less common symbols. Often, sections originating from the above examples would be single-connected, whereas true staveline sections would normally be connected both forwards and backwards.
-99-
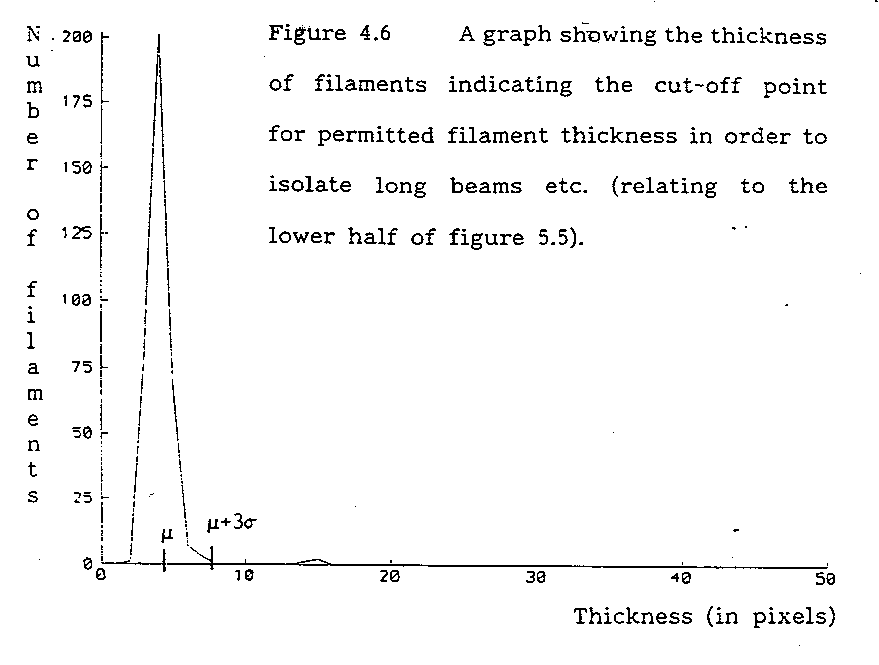
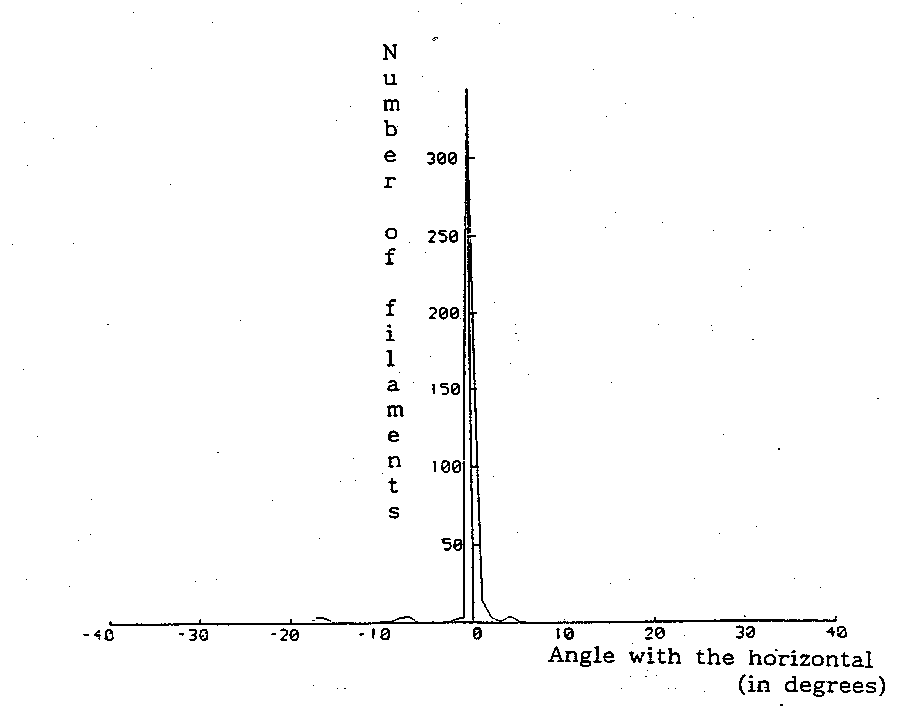
Figure 4.7 A graph showing the angle formed between the centre-line of filaments and the horizontal (relating to the lowest system of figure 5.5).
-100-
Unfortunately, due to poor print quality, breaks in stavelines occurred quite frequently. This produced single-connected staveline sections, hence the pre-processing stage described previously. This alleviated the problem to a large extent because breaks were often very short. It did become apparent, however, that it was more appropriate in the general case to alter test ii) to 'single-connected', thus eliminating some non-staveline filaments which were zero-connected but permitting true staveline filaments which had an adjoining break. This meant erring on the side of including some incorrect (i.e. non-staveline) filaments rather than excluding correct filaments. A significant number of non-staveline filaments may also be eliminated by using a histogram of the angles formed by filament centre-lines and the horizontal, for the whole page (figure 4.7 shows this for part of the image in figure 5.5). Even if the page was rotated (within the permitted tolerance) a main peak would show the large number of staveline filaments at one angle, whilst hairpins etc., could normally be excluded.
Test iii) removed slurs which were both long and thin and also cut through other symbols (making them connected), because they had a high curvature value - obtained as part of the least squares fit procedure. The curvature threshold had, however, to be high enough to include bowed stavelines, and the value of beta given above was found to satisfy this aim when using the test images.
4.6 FILAMENT STRINGS AND STAVE FINDING
In order to establish the presence of a stave, five
-101-
horizontally overlapping and roughly equi-spaced filaments had to be found. The obvious way of achieving this involved stepping through the filament list and comparing the filament under test with as many of the other filaments as was necessary to determine whether or not it formed part of a stave. In the system under discussion, this process was simplified and hastened by concatenating the filaments into filament-strings, which then underwent the requisite tests.
The centre-line of each filament was projected to the right by a distance of 0.25 x the length of the filament and tests made to detect the presence of another filament within +/- twice the mean filament thickness on either side of the projected centre-line. If such a filament was present, then it was combined with the current filament to form a filament string. All filaments which were included in a filament string were flagged to eliminate them from further testing. When the list of all the filament strings in the image was complete, each was tested to establish the number of concurrent (i.e. horizontally overlapping) filament strings. These, assuming they existed, were then measured for vertical spacing from the filament string under test and a list of spacings established. A best fit was obtained for the spacings between the filament string under test and, if possible, four of the others in the list, with a threshold for the maximum spacing. A threshold had to be set for the maximum possible spacing otherwise matches could have been made between stavelines from different staves and possibly also with hairpins. It would have been inappropriate, in order to prevent this, to invalidate a match because an extraneous filament existed within the potential
-102-
stave, as this could be a valid situation. For example, a hairpin might be superimposed on a true stave.
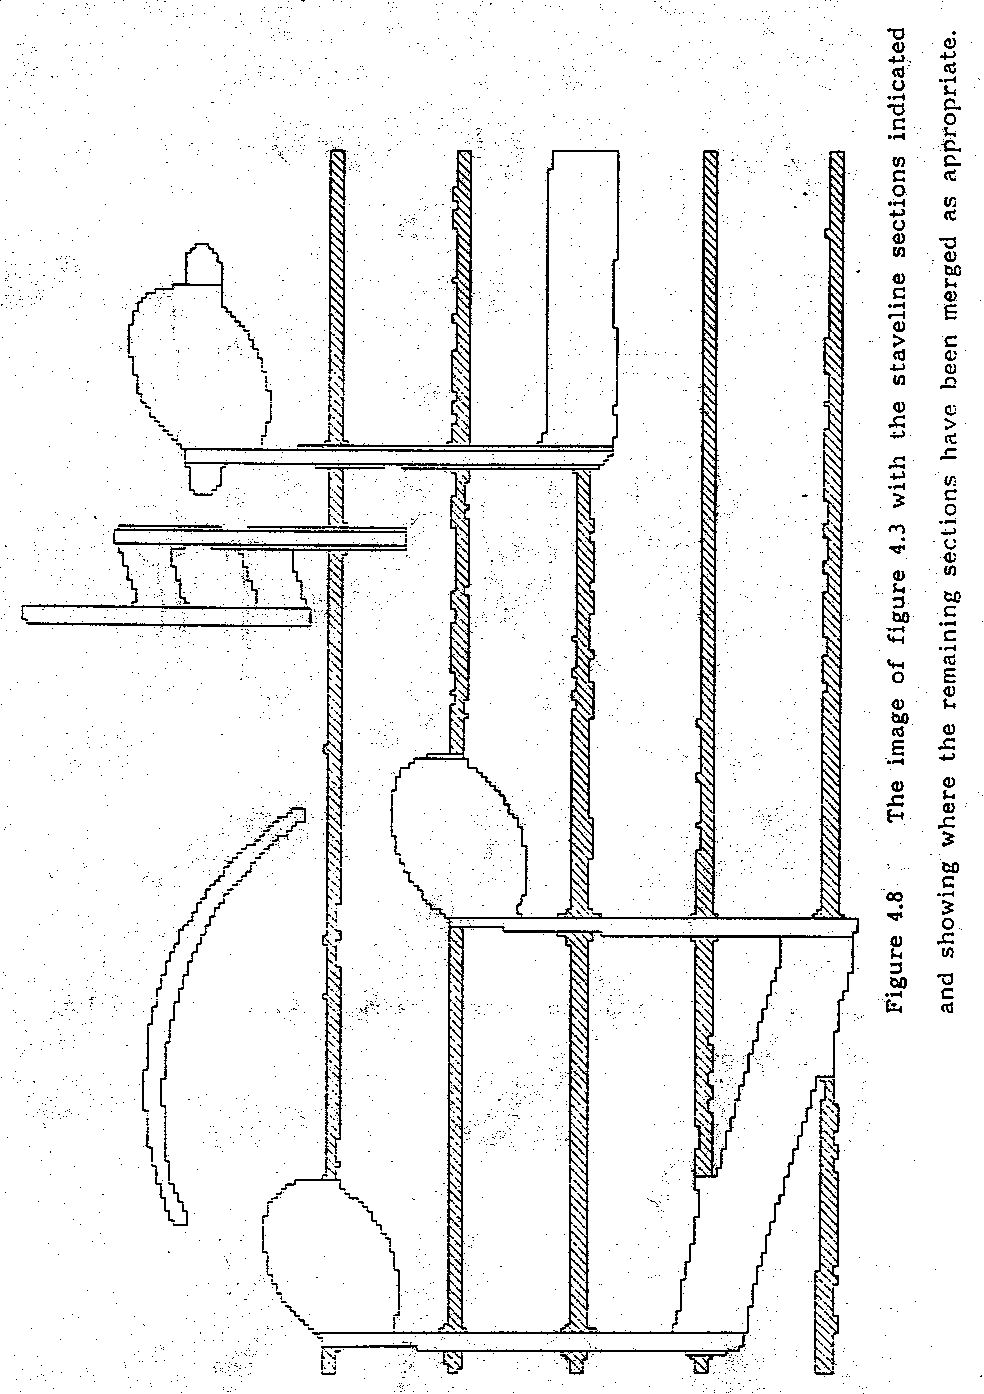
Once a stave had been found, each staveline was tracked across the page in both directions and all sections which fell within the projected path of the staveline and were below the threshold for permitted filament thickness were flagged as staveline sections (figure 4.8). The tracking was achieved by using the section connections obtained from the transformed LAG in conjunction with local centre-line projections. This structural method could also traverse breaks in stavelines which remained despite the pre-processing.
After all the staves present in the image had been found, and all stavelines tracked to their full extent across the page, a restructuring of the transformed LAG was performed. This involved stepping through the section list and categorizing sections' forward and backward connections into staveline and non-staveline sections. Consequently, the sections' data records also contained pointers to lists of forward and backward connections to staveline sections. Merging was again undertaken, as described in section 4.4, in this instance where non-staveline sections had now become single-connected - ignoring connections to staveline sections - and the thickness ratio test was passed. Musical symbols were now, in effect, isolated from the stavelines (figure 4.9).
4.7 SIMPLIFICATION OF THE TRANSFORMED LAG
Even after noise removal, the transformed LAG contained
-103-
-104-
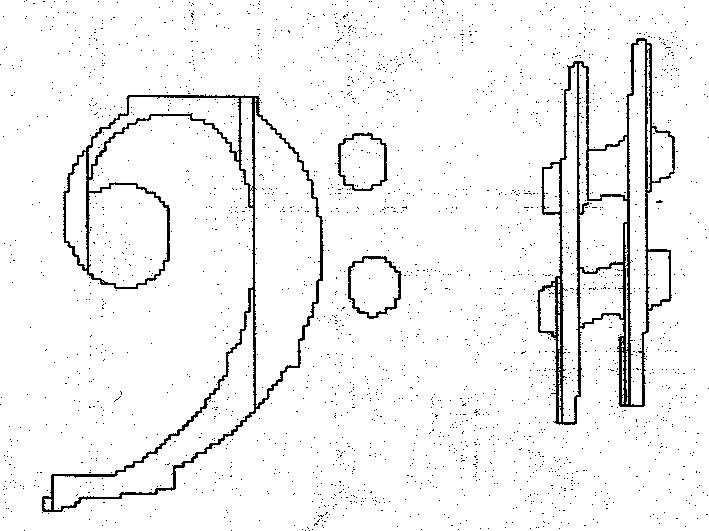
Figure 4.9 A sectioned image fragment with the staveline sections removed.
-105-
numerous non-staveline sections which did not represent structurally significant parts of the image. Mostly, these had a high vertical aspect ratio and were either the result of parts of the image forming a small angle with the vertical (and hence with the run length encoding) or short breaks in vertical runs of pixels (see, for example, figures 4.8 and 4.9). This led to the development of two approaches to further processing. The first is outlined below, while the second is detailed in section 4.11 (ANALYSIS OF BEAMED NOTE GROUPS). As part of further development work, the two techniques will be integrated within the system to give complimentary tools for use in processing symbols.
As a result of the nature of the structurally insignificant sections, any section which fulfilled the following criteria was removed from the transformed LAG:-
i) Vertical aspect ratio >= delta
ii) Single connected to a section which either:-
a) has a bounding rectangle larger than or equal to that of the section under test
or
b) has a vertical aspect ratio >= delta and its area is greater than that of the section under test
(if the section was single connected in both directions then the section was removed if either connection satisfied test ii)).
The value of delta used was five.
When a section was removed as part of the above process, the appropriate inter-section connections were maintained. The
-106-
non-staveline sections in the resulting transformed LAG were almost entirely sections which were structurally significant.4.8 OBJECT FORMATION
An object was considered to be a group of connected sections (references to connections now refer to connections to non-staveline sections only), details of which were stored together in a data structure. Figure 4.9, for example, contains four objects. Objects were found by stepping through the section list, ignoring staveline sections, and commencing a depth-first traversal of the transformed LAG at each section which had not already been included in an object. An algorithm for depth first graph traversal based on that given in the work of Hopcroft and Tarjan [1973] was used. Various statistics were established for each object as the traversal took place and were stored as members of the object data structure. These included co-ordinates of the bounding rectangle, area (sum of constituent sections' areas), and number of sections which comprised the object.
4.9 SYMBOL ORDERING
Each object (single symbol or overlapping symbols) in the object list was ordered with respect to the complete page, i.e. left to right, and bottom up within columns, as a result of its derivation from the section list. Hence, the ordering of the object list bore no relation to the musical structure of the image. Each object had associated with it one or more stave numbers which were found during the object formation process by
-107-
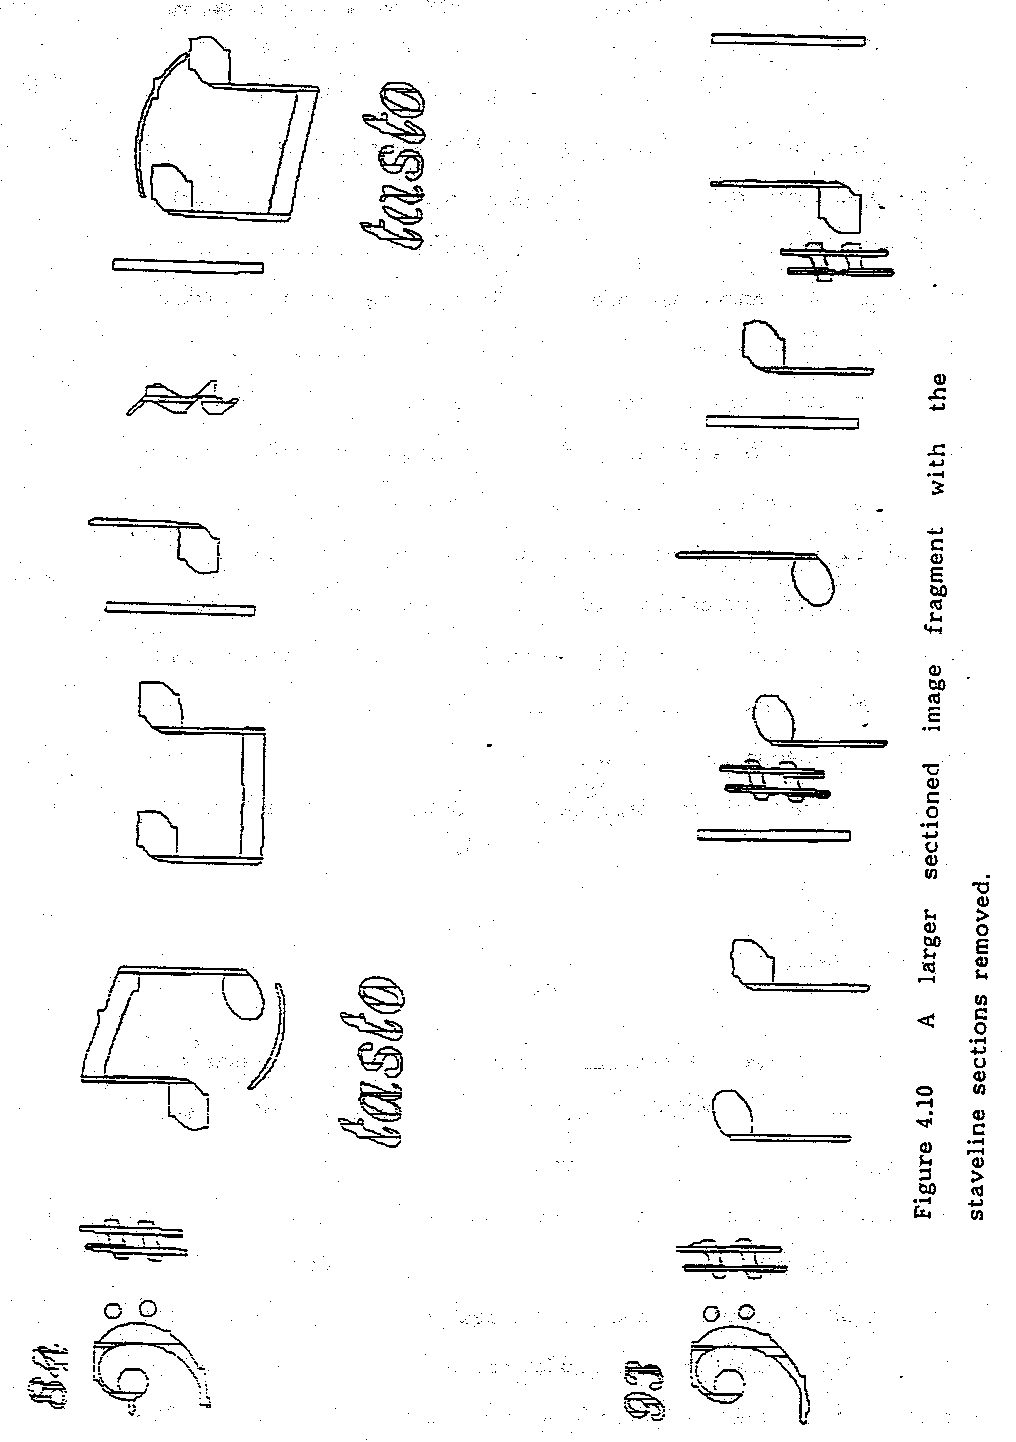
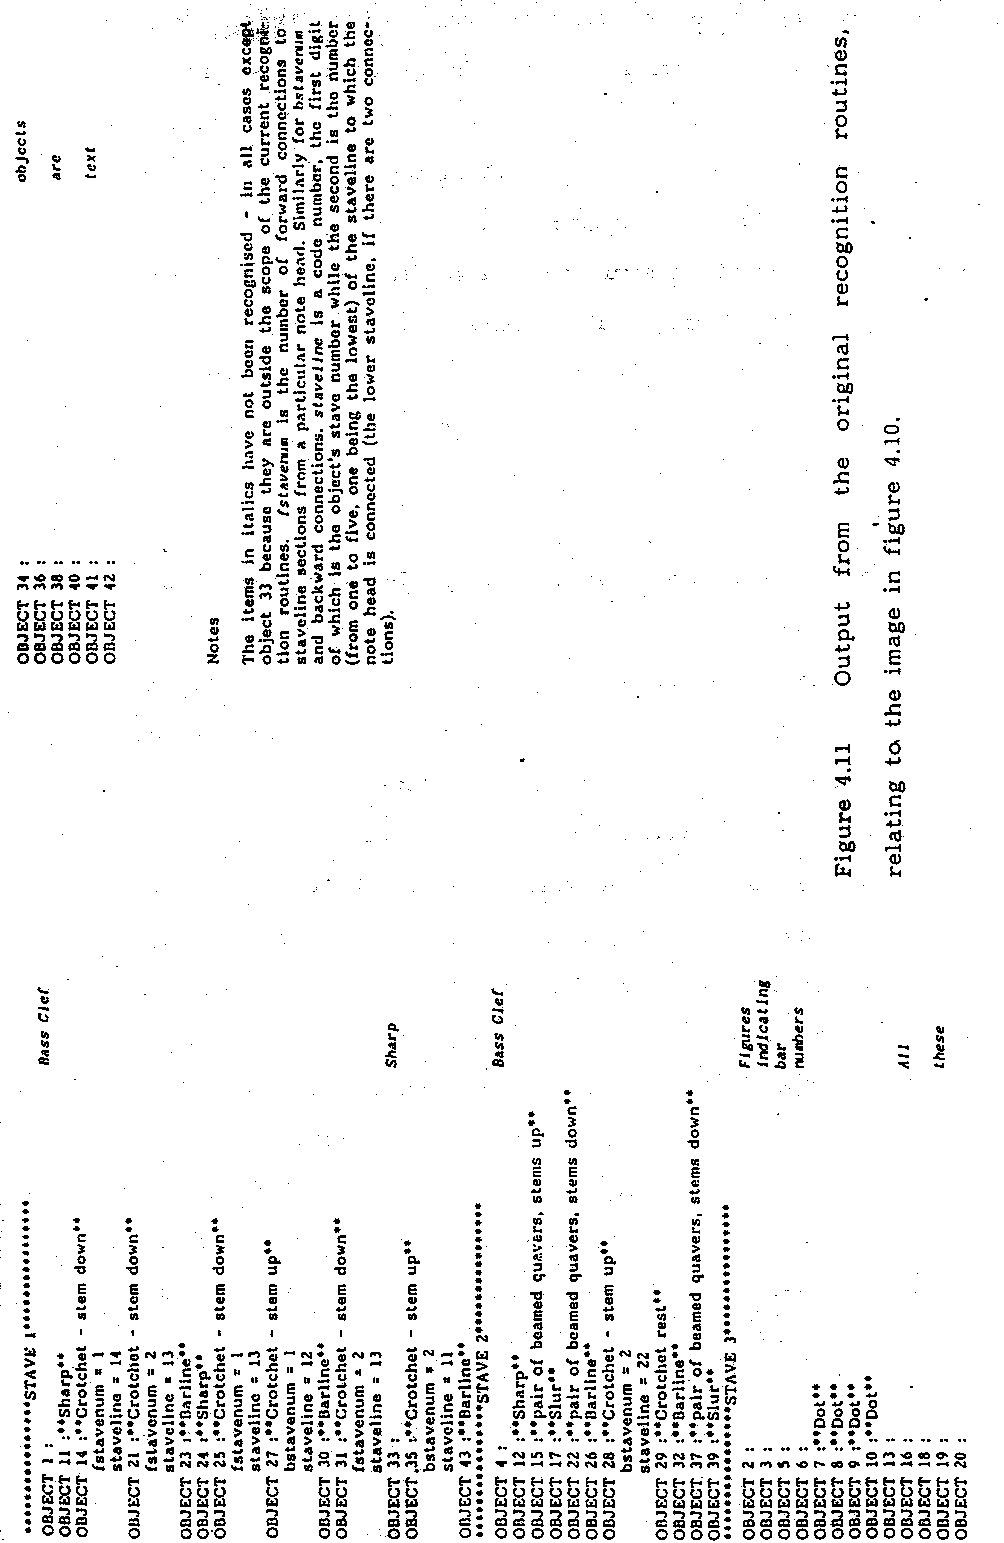
referring to the stave number of each of the staveline sections connected to the sections which made up the object. Using the object stave number (or numbers), the symbols could be organised by stave and ordered, simply, from left to right. A separate group of objects contained those which did not come into contact with a staveline, for example semibreves on ledger lines, dots of various' kinds and some slurs (figures 4.10 and 4.11). This method of initial ordering normally accounted for a large proportion of the notes, rests, clefs and barlines in any image and only omitted symbols such as 'free-standing' slurs whose implied 'connections' needed to be established by a separate process. The spatial organisation of musical symbols - and indeed the significance of this - becomes far more complex when dealing with keyboard music, say, where voices will sometimes cross from one stave to another and simultaneous events will not necessarily be vertically aligned. These problems will be the subject of future research activity.
4.10 RECOGNITION
A combination of several techniques was used in order to achieve recognition (figures 4.10 and 4.11). Simple symbols such as crotchets, barlines, accidentals and quaver rests could be recognised by the size of their bounding rectangle and the number and organisation of their constituent sections. For example, a crotchet on the stave normally consisted of just two sections, one of which had a high vertical aspect ratio (the stem) and the other an average thickness slightly less than the staveline spacing. The pitch of the note could be found by either examining the staveline
-108-
-109-
-110-
number of the staveline section(s) connected to the notehead section, or - considering the possibility of breaks between notehead and staveline - the vertical position of the centre of gravity df the notehead section with respect to local staveline sections. The sharp sign which has not been recognised in figure 4.11 has had one of its structurally significant sections removed by the staveline-finding routine. Only models of ideal forms of symbols were used at this stage, to show how successful the application of these could be given the structural breakdown provided by the transformed LAG.These models were used in conjunction with rules which specified relevant dimensions or spatial organisation for the constituent sections. Each model consisted of the number of sections which constituted the ideal form of the appropriate symbol, together with the number of forward and backward connections for each section. This form of model only guaranteed a one-to-one correspondence between model and symbol type for the sub-set of notation being processed, i.e. it was possible that a match existed between a model and a symbol outside this sub-set. Models were included for the following single section objects:- slur, barline and dot. A high (> 5) horizontal aspect ratio was used to indicate a slur, a high vertical aspect ratio indicated a barline and a single-section object which satisfied neither of these conditions and was enclosed within a bounding rectangle with side length less than the stave space height, was classified as a dot.
An object consisting of two sections was classified as a
-111-
crotchet. If the first (i.e. leftmost) section had a high vertical aspect ratio, it was deemed to be the stem, and the crotchet described as 'stem down', otherwise the stem' direction was taken to be up. A further test checked the average thickness of the other (notehead) section, confirming that this was less than or equal to the stave space height.Three types of eight-section object were included; a sharp sign, a group of three beamed quavers and a crotchet rest. The number of forward and backward connections of each constituent section were used to make the distinction between the first two symbols, while the presence of a high vertical aspect ratio section as the first (leftmost) section as part of the beamed group indicated 'stems down'. If neither set of connections was appropriate and the width of the bounding rectangle was equal to the stave space height +/- 20%, whilst the height was between three and four times the stave space height, the object was classified as a crotchet rest.
A four-section object was deemed to be a flat or natural, provided its vertical dimension was between two and three times the stave space height. The ratio of the average height of the first (leftmost) and last (rightmost) sections was used to distinguish the two symbols; 1 : 0.8 or greater indicating a flat.
Five-section objects which were modelled included a quaver rest and a pair of beamed quavers. The list containing the numbers of forward and backward connections for each constituent section were used to distinguish between the symbols. The same test as that used on the group of three beamed quavers was used to detect
-112-
stem direction within the beamed group and an optional check for the presence of noteheads, using the average thickness measure, could have been added. A model for the main portion of the bass clef was later added to this category.
To summarise, the above implementation enabled recognition of the following types of symbol:- slurs, barlines, dots, crotchets, sharp, flat and natural signs, quaver and crotchet rests, bass clefs and beamed groups of two or three quavers. Figures 4.10 and 4.11 provide an illustrated example of recognition results achieved using this representative selection of symbols. All the above relied upon the isolated object having the correct topology, and, as shown in figure 4.11, this was not necessarily the case.
More complicated symbols such as beamed note groups needed more effort in order to achieve correct classification. A separate algorithm was developed which examined all beamed note groups, counting ledger lines and beams as it proceeded. This was achieved regardless of beam fragments occasionally running together due to the printing process, which removed the correspondence between single beam sections in the transformed LAG and beam fragments in the image which ran from note stem to note stem. This approach was, however, found to be too vulnerable to rotation of either the individual object or the entire image, so an alternative method was devised, as described in the following section.
Output was originally in the form of a text description of the recognised symbols. The categorisation of symbols by stave (outlined in section 4.9 above) can be seen in figure 4.11 - the third group of symbols are those which were unconnected, physically, with a stave. This form of output was convenient for
-113-
providing feedback during the debugging process but needed to be replaced by M.R.L. data for practical use, i.e. interfacing with other software. No M.R.L. was used until the last possible opportunity, to avoid tying the system to a particular representation scheme and to keep the M.R.L. data production stage as a self-contained module which could be replaced as required. A detailed discussion of the SCORE desktop music publishing package and examples of uses of its M.R.L. in conjunction with the author's system are included in chapter 5. SCORE was chosen as the most comprehensive music printing software package available and also because the M.R.L. used within the package was fully documented.
Overlapping or superimposed symbols will have to be separated out by a specific algorithm. Proposals for this are given in chapter 5. This is similar to the not insignificant problem of character separation [Kahan 1987] but far more complex due to the 2-D organisation of music notation (see section 3.2 for further comparisons regarding dimensionality).
4.11 ANALYSIS OF BEAMED NOTE GROUPS
Initially the method for simplifying the transformed LAG outlined above was applied to beamed note groups. It was found that this approach was not robust enough to cope with the general case because it relied upon the notestems involved being very nearly vertical (sections with high vertical aspect ratio were identified as note stems and analysis proceeded on that basis). This approach had to be considered inadequate because the assumption was often not true, especially in the case of long
-114-
notestems and also when considering the original aim of making the system immune to rotation of +/- 10°. With this in mind, and also in an attempt to benefit from the success achieved in segmenting stavelines irrespective of imperfections including rotation; a new approach was devised. This was based on the same transformed LAG as had been used previously, but with the segments (the continuous runs of pixels in the run-length encoding) orientated horizontally. An investigation into the feasibility of deriving the new transformed LAG from the original section data for the object showed this to be inefficient and, in any - event, unnecessary. Instead, the operation was implemented simply by reconstructing the object in a separate image (figure 4.12), and applying a new routine for run-length encoding together with the original sectioning routine. The horizontally-orientated run-length encoding of the object in figure 4.12 is shown in figure 4.13 and the new sections derived from this data are shown in figure 4.14. The new transformed LAG could then be searched for sections with high aspect ratio - a feature taken to indicate a vertical line, in this case a notestem.
Those sections with an aspect ratio greater than or equal to gamma (where gamma was equal to five) were selected as vertical lines and have been removed in figure 4.15. This then left the noteheads and the beaming complex (a single beam or a combination of multiple or partial beams treated as a single unit). These components were, however, to be represented using section data based on the original orientation of run-length encoding, as this would more closely resemble the underlying structure. Again, a feasibility study was undertaken, and the possibility of deriving the required
-115-
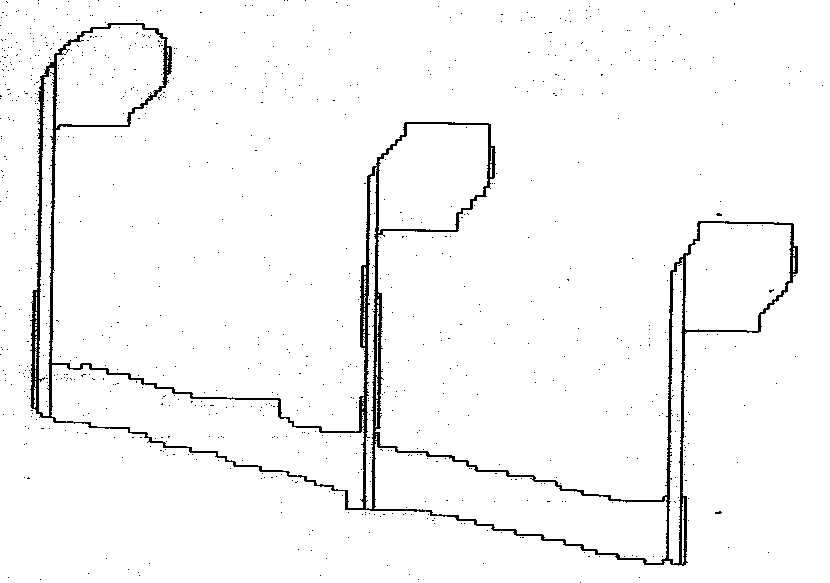
Figure 4.12 A sectioned beamed note group (with noise sections removed).
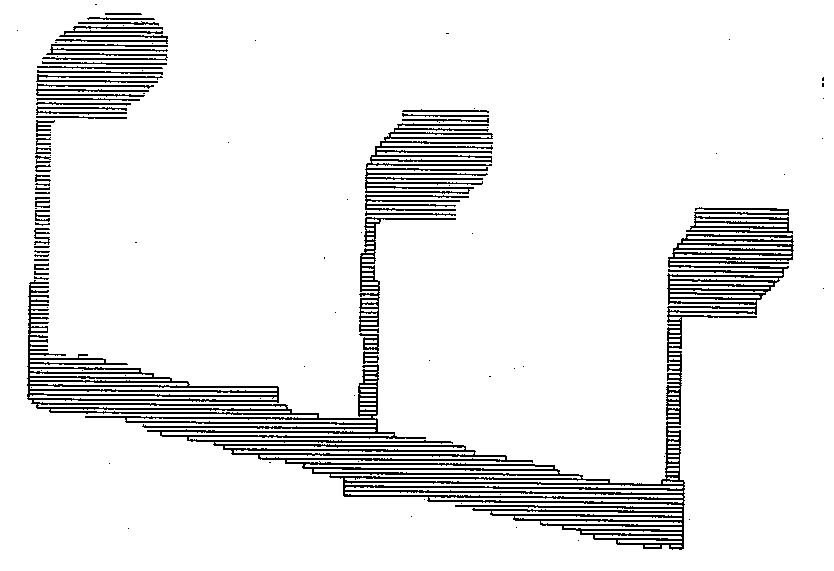
Figure 4.13 The object from figure 4.12 run-length encoded with the segments orientated horizontally.
-116-
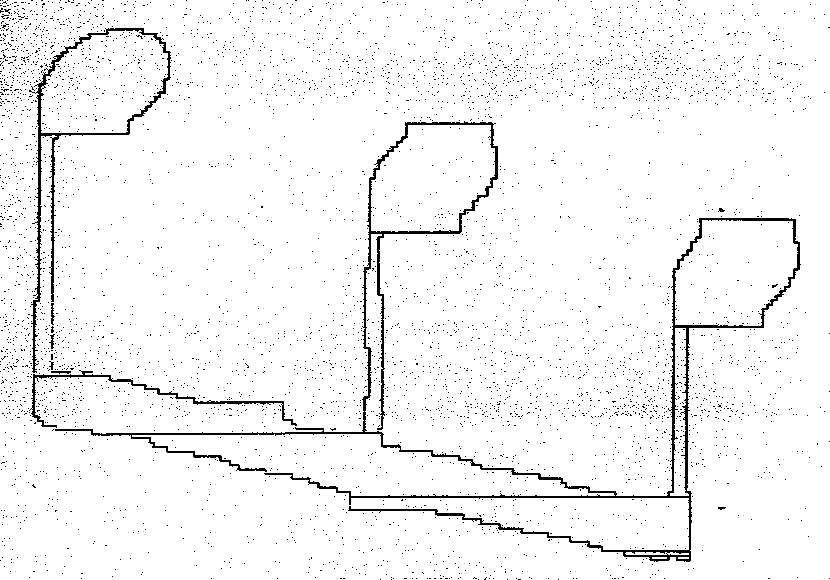
Figure 4.14 The sections derived from the run-length encoding of figure 4.13.
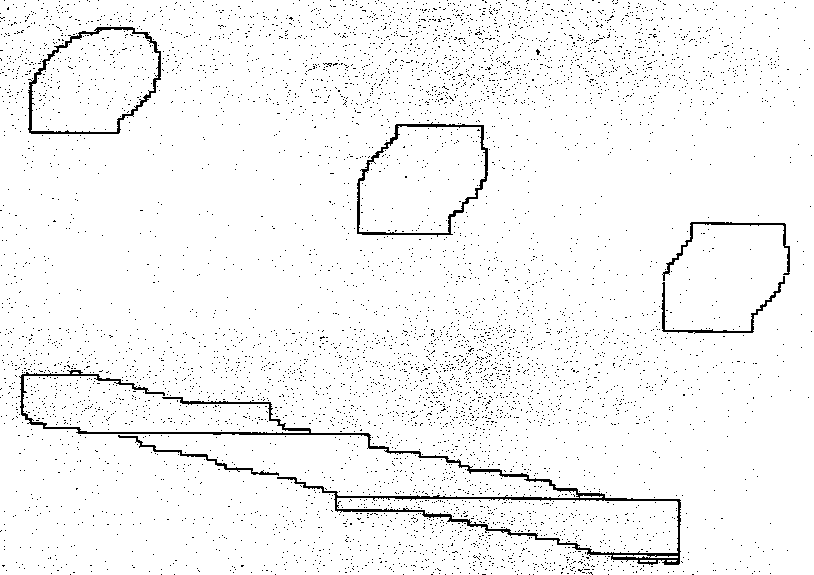
Figure 4.15 The high aspect ratio sections removed frdm those shown in figure 4.14.
-117-
section data by operating on the original section list for the object was examined. This would have entailed removing from the corresponding sections those complete or partial (vertical) segments which lay within the region of the object designated as 'notestem' and merging, removing or creating sections as necessary. The number of possible permutations of these last three operations made this a complex option to implement. In contrast, the chosen method simply involved erasing the notestem sections in the image containing the reconstructed object (as in figure 4.15) and then re-sectioning the remaining parts of that image using vertically-orientated run-length encoding (figure 4.16). The direction of the notestems was then found by searching to the left of the first (i.e. leftmost) notestem for a notehead. The search region was defined as having its right hand side formed by a line parallel to the centre-line of the leftmost notestem and its upper side a horizontal line extending from the lowest extremity of the notestem section. The other two sides of the region were formed by the edges of the image. If a section with an area greater than (.5 x the average staveline spacing)2 was found, then this was taken to be a notehead and the notestem direction taken to be up, otherwise it was assumed to be down and a check was made for a notehead at the top and to the right of the stem.
The next stage involved forming the beaming complex into a single object by traversing the constituent sections using the same algorithm for object formation as had been used previously (section 4.8). The starting section for this was found by searching the section list for one which contained a pixel from the row adjacent to the appropriate end of the notestem region.
-118-
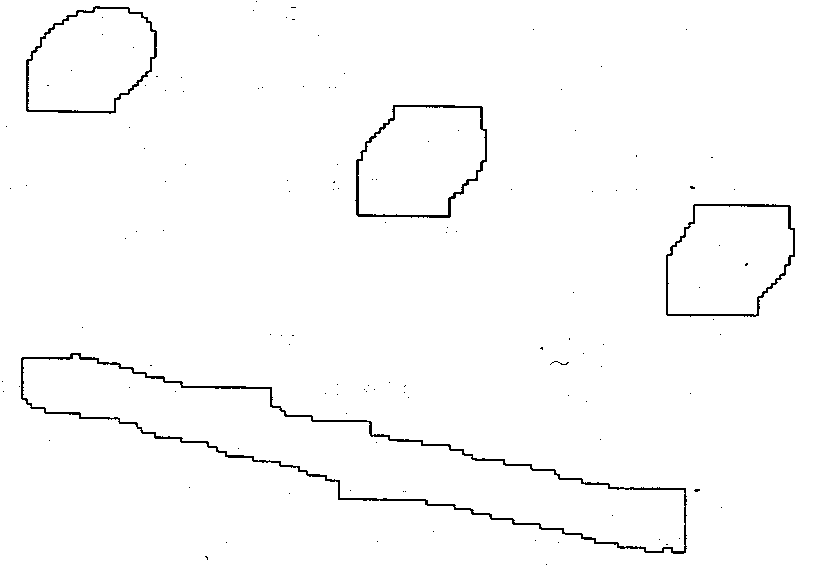
Figure 4.16 The image of figure 4.15 sectioned using vertically-orientated run-length encoding.
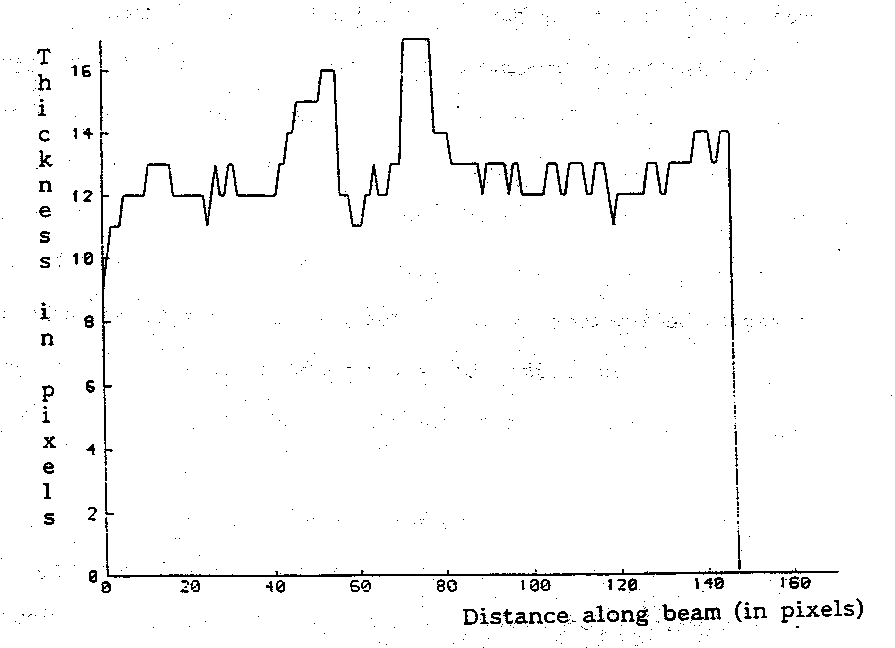
Figure 4.17 A graph of overall beam thickness for the beaming complex shown in figure 4.16. (The average staveline spacing relating to this object was equal to 21).
-119-
Once the beaming complex had been formed into an object, a list of values for thickness could be ascertained by establishing the lowest and highest parts of the object for each column over its entire length. The distance between each pair of points gave the thickness for that particular column (figure 4.17). By using this approach, it became irrelevant whether the notestems continued through a set of multiple beams or ended as they contacted the first of the beams, as is the case in some styles of engraving. Also, a break in one or more of a set of beams would not be of consequence provided that at least enough connections existed in order to preserve the connectivity of the constituent sections of the beaming complex. The rhythm values for the individual notes were determined by calculating the average overall thickness of the beaming complex in one or two regions, as appropriate, to the side of each note stem. The width of these regions was set equal to the average stave space height. If two measurements were taken (for an inner note of a beamed group of three or more notes) the larger of these was used in the following calculations. If the thickness was below rho x the average stave space height, the note was taken to be a quaver, if more than this but less than (1 + rho) x the average stave space height then a semiquaver, and above this, a demisemiquaver. The value of rho commonly used was one. These thresholds could be extrapolated to include shorter rhythm values.
This technique has proved reliable for the general treatment of standard notation but it seems that further analysis would have to take place if cue-sized notation was also to be processed. Investigation of the holes present in the beaming complex would
-120-
seem to be necessitated, a procedure which could also prove useful as a second source of information when dealing with standard-sized notation. The noteheads were found by searching either above and to the right of, or below and to the left of, each notestem, as appropriate, and applying the area criterion used in finding the initial notehead. Pitch was determined by examining the staveline section connections from the equivalent region in the original object. Again, this involved matching regions between different representations, in this case between the - now partiallv - reconstructed object and its original section list. Once the corresponding notehead section or sections had been found, the position on the stave could be determined from the stave number, or numbers, of the staveline section connection or connections. Alternatively, as mentioned previously, the relative positions of the centre of gravity of the notehead and the nearest staveline sections could be used.
This technique proved successful in that it was suitably robust given rotation of the object or image, or varying line thickness, length or straightness. As a consequence of this, the technique could also be usefully applied to other symbols containing vertically-orientated linear components. These include all individual notes with stems, barlines, quaver (and shorter duration) rests, sharp, natural, flat and double flat signs, boxes (surrounding bar numbers or text - see figure 5.1) and brackets.
As mentioned in section 4.7, the complete integration of the above approach with that of simplifying the original transformed LAG is a future aim. The overall robustness of the recognition
-121-
system should be significantly enhanced by this combined approach, because linear components will be appropriately sectioned whatever their orientation (given that the angle made with one version of the run-length encoding will have to be between 45° and 90°). Non-linear components have been seen to be appropriately sectioned by the original transformed LAG, thus giving a unified approach to object decomposition. Further discussion and examples of initial applications of this reasoning can be found in chapter 5.
4.12 SYSTEM PARAMETERS
The parameters of the system, which have previously been referred to using Greek letters, are listed together in this section for reference. The number in brackets following the description of each parameter is its most commonly used value.
alpha = minimum aspect ratio (i.e. length / average thickness) of a filament. (10)
beta = maximum curvature (variance figure of least squares fit) of a filament. (1)
lambda = maximum area of a noise section (in pixels). (5)
delta = minimum vertical aspect ratio (average thickness / length) for a section to be removed under the process of section 4.7 - simplification of the transformed LAG. (5)
phi = maximum number of continuous background (white) pixels (bordered by black pixels) in a horizontal row to be filled by the pre-processing low-pass filter. (4)
rho = proportion of the average staveline spacing to be used as the threshold in differentiating different rhythm values when
-122-
analysing beamed note groups. (1)
gamma = minimum aspect ratio for a section to be considered as a vertical line by the beamed note group analysis routine. (5)
The values for the above parameters were not rigid but those given in brackets above were found to be widely applicable. The avoidance, as far as possible, of the use of absolute measurements led to the adoption of aspect ratios (alpha, delta and gamma) which preserved the size-independence of the system. Where pre-processing was used, the value of phi could be reduced with the advantage of diminishing processing time, while not having a very adverse effect on later operations. The value of lambda could also be reduced, with similar effects.
-123-